
The group Overview
The Overview in Group View shows how every location is doing, side by side.
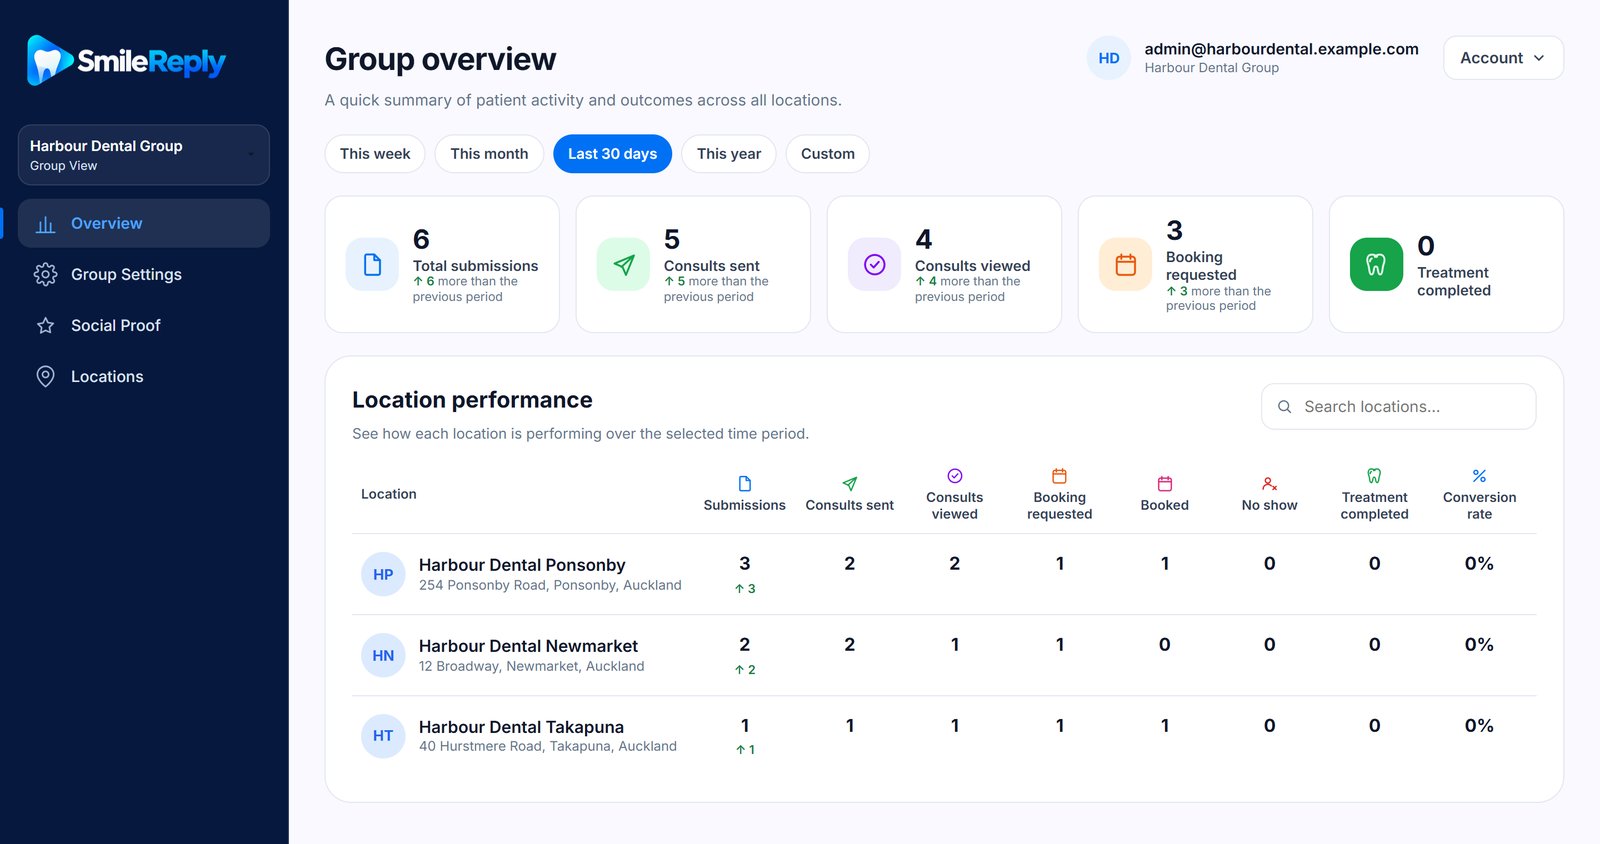
Choose a period
Choose This week, This month, Last 30 days, This year or Custom. Each total is compared with the period of the same length just before it.
The totals
Across all your locations:
Total submissionsPatients who sent their photos.
Consults sentConsultations sent to patients.
Consults viewedPatients who opened theirs.
Booking requestedPatients who clicked the booking button in their client portal.
Treatment completedPatients marked as treatment completed.
Location performance
One row for each location, with its submissions, consults sent and viewed, booking requests and outcomes. Use the search box to find one quickly.
Conversion rate is the share of the period's patients who have gone on to complete treatment. Treatment can finish months after a patient first gets in touch, so it's most meaningful over a longer period, like this year.
Still stuck?
Contact supportMessage us from your dashboard and we’ll get back to you as soon as possible.